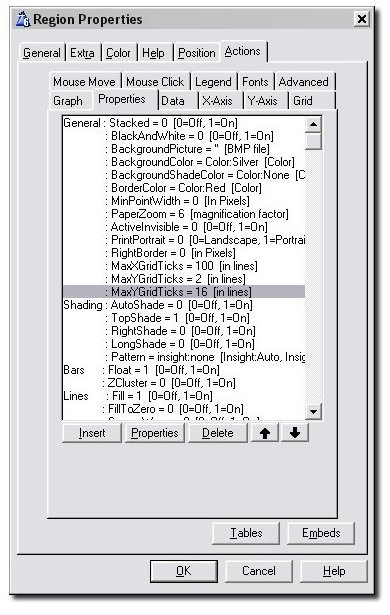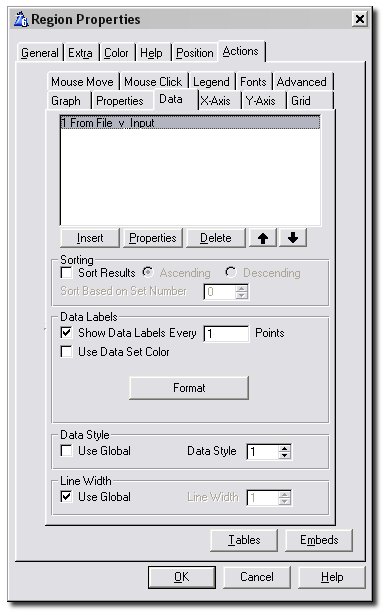
The Data Tab is where you enter all the files, queues, views and variables you will be plotting data on the graph from. Information regarding sorting,
data labels and the style you want your data plotted in is also entered here.
- List Box: This contains all the information about the Data you are wanting to plot. Each entry in this list box represents either a File, Queue,
View or Memory Variable. The different things you can set in this list are covered in the next sub-section of this document. To get there, click on the
Properties button in the above screenshot or go to the section on the
Primary Source Tab.
- Sort Results: This allows you to sort the points along the x-axis based on their value. For example, say you had a bar graph and
wanted the bars to go from tallest to shortest. This feature can be used to achieve this.
- Based on Set Number: This determines how the sorting (explained in the above point) works if you have multiple sets. If this is set to 0 then the sum of all the sets (at the same point) is calculated, and the points on the x-axis will be sorted according to this sum. Alternatively, if a set number is specified, the sorting will be done according to the values inside that one set.
- Show Data Labels: Switch this on if you want labels for the data points to appear on the graph. Data labels normally appear at the top of a bar, near a point on a line, near a point on a scatter graph or next to a slice of a pie, and show the exact value for that bar, point or slice. Data labels for individual sets can be turned off using the
Suppress Data Labels option on the
Advanced Tab of the Set Window.
- Every Point(s): (Intermediate and Advanced Level Graphs) Allows you to display the data labels for only some of the data points. Useful if you have a lot of data points on the graph.
- Format: Optionally enter a Picture Format here. This lets you, for example, easily specify numeric or financial display pictures for your data labels. You can use the
... button to assist you in selecting the correct picture.
- Short (Format Window): If this option is on then the value in the data label is reduced to only 2 or 3 significant digits. For example, 123456 becomes 123K, 123456789 becomes 123M and 1234 becomes 1.2K. The unit (K, M, etc.) can also be turned on and off (see the next point).
- Unit (Format Window): If the Short option is on (see the point above), ticking this option causes the Unit to be displayed behind the short number.
K is for thousands,
M is for millions and B is for billions.
- Use Data Set Color: Tick this if you want the data labels to have the same color as the set the corresponding data points belong to.
- Value (Pie Only): Displays the value of each slice of the Pie in the data label.
- Percent (Pie Only): Displays the value of each slice of the Pie as a percentage of the whole in the data label.
- Name (Pie Only): Display the name of the pie slice in the data label.
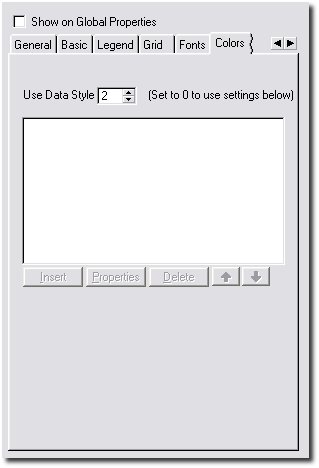
- Data Style: Use this to select a predefined scheme that assigns colors and styles to all of the entered data sets. Set this to 0 (blank) to use the
global Data Style (set on the
Global Colors Tab), or check the Use Global checkbox. For an individual set, the data style and colors assigned to it by the selected scheme can be overridden by going to the set's
Colors Tab and
Style Tab.
- Line Width: If the Use Global checkbox is ticked, the line widths specified on the
Global Basic Tab will be used to draw the data. Untick this to specify your own. The provided spin box can be used to override the line widths specified on the
Global Basic Tab.
Primary Source Tab
On this tab, you first make a selection from the Data From dropdown (see the point below), and then the remaining options change according to your selection.
- Data From: Choose one of File (Generated View), Queue, Variable or Hand-Coded View. If the data you're wanting to plot is in a data table (file) then select File,
and if the data is in a Queue then select Queue. If you want to plot a single point from a memory variable then choose Variable. Lastly,
if you want to build your own View structure for reading the data then select Hand-Coded View.
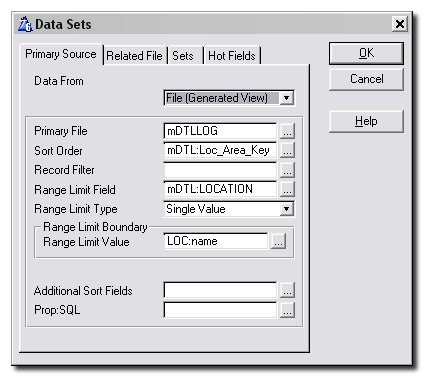
When choosing
File, your options are as follows:
- Primary File: The name of the primary file for this set.
- Sort Order: The name of a key. This is the order in which the fields will be read from the file. However, see
Additional Sort Fields below if you want to order the View in a non-keyed order.
- Record Filter: If a filter is entered here, records which don't pass the test (if the expression evaluates to False) will be excluded from the graph.
- Range Limit Field: This field acts as the range for the View. Records outside of the range will be ignored.
Tip: Check where you can use a range instead of a filter, as a
range is much faster.
- Range Limit Type: Specifies whether the range is either a single value or a range of values.
- Range Limit Value,
Low Limit Value,
High Limit Value: These all set the borders of your range. The latter two options only appear if you have chosen your Range Limit Type to be a range of values.
- Additional Sort Fields: If you wish the view to be sorted on un-keyed fields then use this option. However,
bear in mind that this may seriously reduce performance for some file drivers.
- Prop:SQL: This allows you to set a Prop:SQL for the View. The command will be sent to the SQL engine after the View is opened.
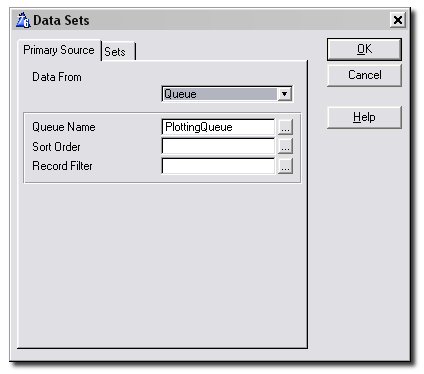
When choosing
Queue, your options are as follows:
- Queue Name: This is the name of the Queue itself.
- Sort Order: This field can be left blank. Use a normal comma delimited list of Queue fields (using + for ascending and - for descending).
This will cause the Queue to be sorted on those fields just before the
Reset method is called. Note that the Queue remains sorted after the graph is drawn.
- Record Filter: Enter an expression here to filter the records in the Queue.
Only records that pass the test (where the expression evaluates to true) will be included in the graph.
When choosing
Variable, there are no options. Move on to the
Sets Tab to specify the variable name. Note that when you choose this option, an
extra X-Axis Tab will appear once you get to the Set Window.
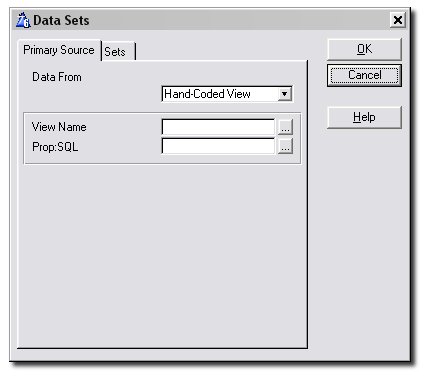
When choosing
Hand-Coded View, your options are as follows:
- View Name: This is the name of the View that you've written.
- Prop:SQL: This allows you to set a Prop:SQL for the View. The command will be sent to the SQL engine after the View is opened.
Related File Tab
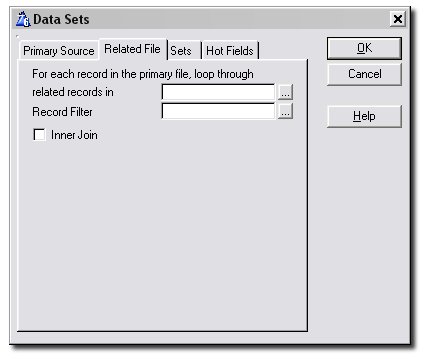
This tab is only visible if the Primary Source is a File. It allows you to enter a file related to your primary file from which data will be graphed.
The fields of this file can, just as with the primary file, be used on the
Set Tab.
- For each record ...: Enter the name of a related secondary file here. For each record in the primary file, Insight will loop through related records in this file.
- Record Filter: Optionally enter a record filter here for the specified related file.
- Inner Join: (Intermediate and advanced Level Graphs) Allows you to make an inner join relationship between the file and the related file. This means that if the child does not exist then no record will be generated for the parent.
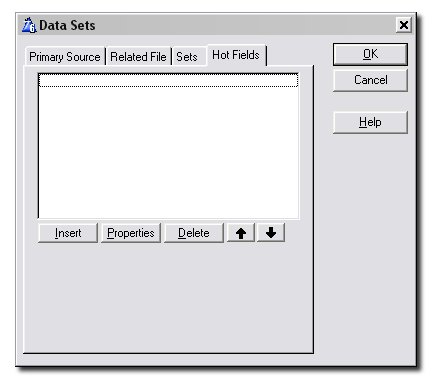
Sets Tab
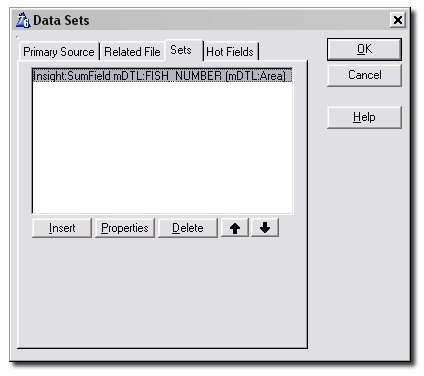
This is the tab where you specify the actual fields being plotted on the graph. You're allowed to have multiple fields (or expressions) per File (or Queue). Click on the
Properties button in the above screenshot to see the tab where this information is entered, or go to the section on the
Set Tab below.
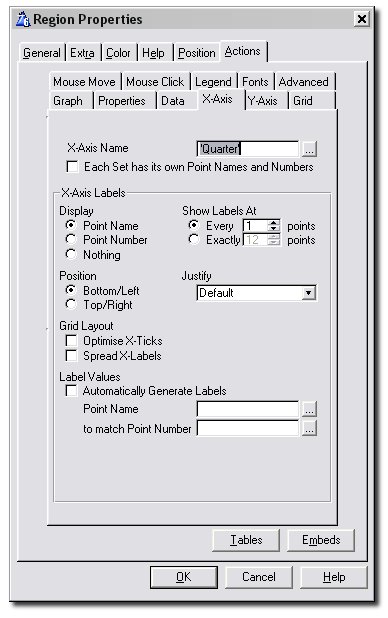
Set Window - X-Axis Tab
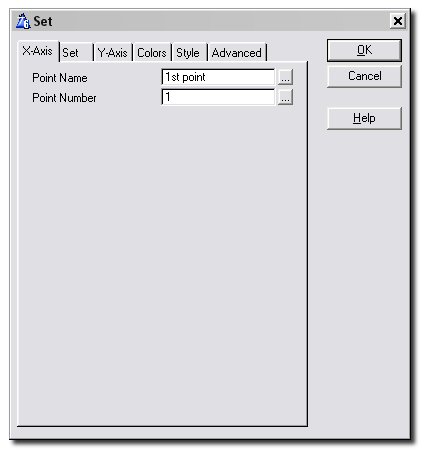
This tab only appears in two cases. The first is if you are using a variable - in this case you would have chosen Variable from the
Data From dropdown on the Primary Source Tab. The idea is, that since a variable is single-valued,
we wont know for which x-axis point the value in that variable should be plotted. Hence, we enter these details here.
The second case where this tab will appear is if you have ticked
Sets have own Point Name and Number Fields on the Main X-Axis Tab.
- Point Name: Enter the point name for the x-axis point of the variable. This can be a fixed value, variable or an expression.
- Point Number: Enter the point number for the x-axis point of the variable. This can be a fixed value, variable or an expression.
Set Window - Set Tab
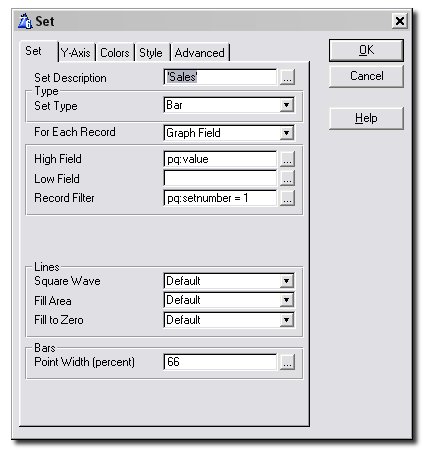
This is where you enter all the details related to the set you want plotted. For example, you specify which field to plot,
the graph type of this particular set and how the data should be plotted.
- Set Description: Enter the name of the data set here. This is used for
Legend and
Mouse Move descriptions. If this field is left blank then the value
for this set will not be displayed when the mouse moves, and this set will not appear on the legend.
- Set Type: Here you can select what graph type you would like this particular set to be graphed as. If left on "Default",
this set will have the graph type specified on the
Graph Tab. This setting allows you to have multiple graph types plotted on the same system of axies.
- For each Record Read: Specify here what you would like Insight to do with every record it reads. Select from Graph Field, Count Record, Sum Field and Average Field.The
Parent Field, Field, Value, Size and other entries appear and are filled in according to the choice made here.
- Graph Field: Enter the Field or Expression that should be plotted on the Graph. With some graph types you may be able to enter additional values.
For example, floating bar graphs have a Low value, Candle graphs have Open and Close values, and so on.
- Count Record: Enter the Parent Field for the counting. When the Parent Field changes, a data point with value the total counted
will be added to the Graph and the counter will be reset to 0. The number of valid records will be counted.
Note: It is important that you sort your data according to the Parent Field for this option to work correctly. See the
Sort Order entry on the Primary Source Tab.
- Total Field: Enter the Parent Field and the Field (or Expression) to sum. When the Parent Field changes,
a data point having value the calculated total will be added to the graph and the total will be reset to 0.
Note: It is important that you sort your data according to the Parent Field for this option to work correctly. See the
Sort Order entry on the Primary Source Tab.
- Average Field: This is the same as Total Field (see the above point), but the Field values will be averaged rather than
totalled. Note: It is important that you sort your data according to the Parent Field for this option to work correctly. See the
Sort Order entry on the Primary Source Tab.
- Parent Field: What you enter here depends on your selection for "For each Record Read" above. See the description for your particular selection above.
- Field: What you enter here depends on your selection for "For each Record Read" above. See the description for your particular selection above.
- Value Field: (Scatter and Pie graphs)
Enter the field that you want plotted on the scatter graph.
- Size Field: (Scatter and Pie graphs) Pies: Use this to specify a maximum size for your pie. This is useful if you have a number of pies on the same screen or report and want them all to be the same size. If you enter a small enough value here this will achieve the desired effect.
Scatter Graphs: You might wish to convey some information about the data you are graphing by the size of the individual scatter points. Enter a field of your queue or file here that should be used to determine the size of the data point.
- Date: (Time graphs) Enter the field that holds the date at which the data values were collected.
- Time: (Time graphs) Enter the field that holds the time at which the data values were collected.
- High Field: (Candle and Hi-Lo graphs) Candles:
For candle graphs, the size of the wick is determined by the High and Low values, and the High value is the highest point of the wick.
Hi-Lo Graphs: The size of the bar is determined by the High and Low values, and the High value is the highest point of the bar.
- Open Field: (Candle and Hi-Lo graphs)
Candles: For candle graphs, the size of the thicker bar is determined by the Open and Close values. Use the
Conditional Point Overrides facility on the
Colors Tab to change the color of the bar depending on whether the price has gone up or down.
Hi-Lo Graphs: The Opening value for a hi-lo graph is displayed to the left of the bar.
- Close Field: (Candle and Hi-Lo graphs) Candles:
For candle graphs, the size of the thicker bar is determined by the Open and Close values. Use the
Conditional Point Overrides facility on the
Colors Tab to change the color of the bar depending on whether the price has gone up or down.
Hi-Lo Graphs: The Closing value for a hi-lo graph is displayed to the right of the bar.
- Low Field: (Candle and Hi-Lo graphs) Candles:
For candle graphs, the size of the wick is determined by the High and Low values, and the Low value is the lowest point of the wick.
Hi-Lo Graphs: The size of the bar is determined by the High and Low values, and the Low value is the lowest point of the bar.
- Record Filter: You can enter an additional filter here. This filter will only apply to this set. You can use this to remove items from the total, average, count or graph itself.
- Lines: Square Wave: Indicate here whether, if you chose this set to be a line graph, you want it to be drawn as a square wave.
- Lines: Fill Area: Indicate here whether, if you chose this set to be a line graph, you want the area below the line graph to be filled.
- Lines: Fill to Zero: Indicate here whether, if you chose this set to be a line graph, you want the area between the graph and y = 0 to be filled.
- Bars: Point Width (percent): Use this to specify how wide you would like your bars to be. For example, if you fill in the value 66 here (the default value), the bars of this set will be only take up 66 percent of the space in width allocated to it. This leaves gaps between it and the bars of other sets at the same point.
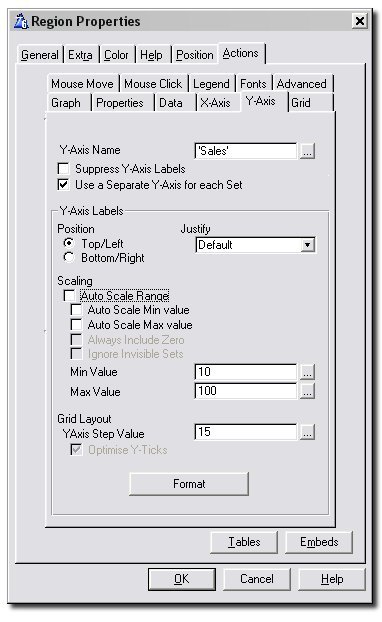
Set Window - Y-Axis Tab (For Intermediate and Advanced Level Graphs where"Use a Separate Y-Axis for each Set " is on)
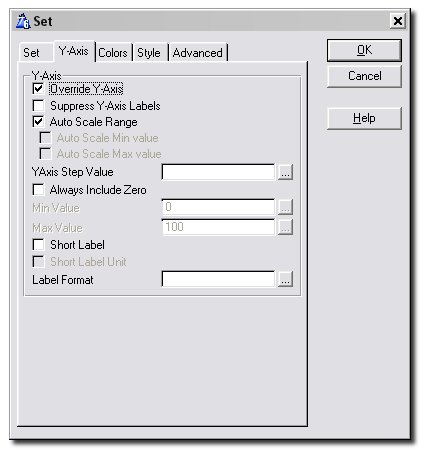
To use this window, the
Template Level on the global
General Tab should be set to Intermediate or Advanced, and
"Use a Separate Y-Axis for each Set" on the main
Y-Axis Tab should be ticked. Use this tab to specify the details for the y-axis to be used for this set.
- Override Y-Axis: Tick this if you want this set to have a y-axis different from the one specified on the main
Y-Axis Tab. Ticking this enables you to fill in the rest of the options on this window.
- Suppress Y-Axis Labels: (Intermediate and Advanced Level Graphs) Allows you to prevent the labels on the set's Y-Axis from being drawn.
- Auto Scale Range: Click this on if you want the Y-Axis to be scaled automatically to fit the data being plotted. Both the Min and Max values for the Y-Axis will be determined automatically by Insight.
- Auto Scale Min Value: If the Auto-Scale-Range option is off, you can tick this on to allow Insight to automatically determine the Min value for the Y-Axis while you fix the Max value manually in the provided entry.
- Auto Scale Max Value: If the Auto-Scale-Range option is off, you can tick this on to allow Insight to automatically determine the Max value for the Y-Axis while you fix the Min value manually in the provided entry.
- Always Include Zero: Tick this on if you want Insight to always include the value y = 0 in the auto-scaled range.
- Y-Axis Step: The Min, Max, and all other Y-Axis labels will be a multiple of this number. For example, entering 10 here will ensure that all Y-Axis labels are a multiple of 10. Note that, if you specified the Min and Max values yourself, your values will be adjusted to fit in with this step value.
- Min Value / Max Value: Allows you to specify the minimum and maximum values for the Y-Axis. This can be a fixed number, a variable, or an expression.
- Short: If this option is on then each y-axis label is reduced to only 2 or 3 significant digits. For example, 123456 becomes 123K, 123456789 becomes 123M, 1234 becomes 1.2K and so on. The unit (K, M or B) can also be turned on and off (see the next point).
- Short Label Unit: If the Short option is on (see the above point), turning this option on causes the unit to be displayed behind the short number.
K is for thousands,
M is for millions and B for billions.
- Label Format: Optionally enter a Picture Format for the y-axis labels here. This lets you, for example, easily specify numeric or financial display pictures for your labels. You can use the
... button to assist you in selecting the correct picture.
Set Window - Colors Tab ( Intermediate and and Advanced Level Graphs)
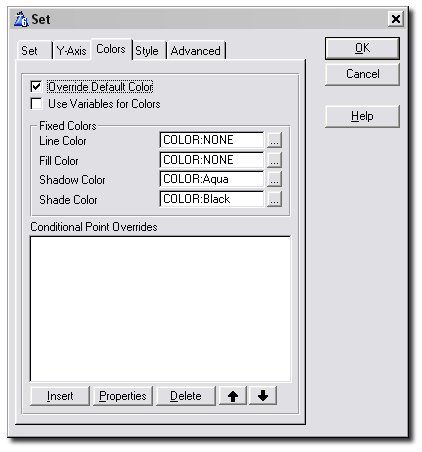
The Colors Tab is used to specify the colors used to draw the data points in this set, including the conditional coloring of data points. Note that this tab is only available when the
Template Level on the global
General Tab is set to Intermediate or Advanced.
- Override Default Color: This allows you to override the default colors as assigned by the
Use Data Style option on the
Data Tab. These changes will apply to the whole set (if you only want to change the color settings of some points in the set then see
Conditional Point Overrides below).
- Use Variables for Colors: Normally you'd select fixed colors for your set, and there is a Color Palette to help you with this.
However, you may want to use a variable, in which case you should tick this option on.
- Line Color: The color used to draw the lines of your line graph.
- Fill Color: The color used for filling polygons in your graph - for example, this color will be used to fill bars, scatter shapes and the
area beneath your line graph if you have chosen to do so.
- Shadow Color: When AutoShade is switched off, this color is used to color the side and back panels of bars.
Leave this blank to have Insight determine the best shadow color.
Tip: AutoShade has to be turned off for you to see an effect here.
- Shade Color: This is the color used to shade bars by
TopShade, LongShade and
RightShade.
Tip: At least one of these shading options needs to be turned
on for you to see an effect.
- Highlight Intensity: If Autoshading is on, this determines how bright the light source on your objects should be. Should have a value between 1 and 100.
- Conditional Point Overrides: This option allows you to override the colors for a select group of points, based on some condition. It allows you to highlight points on the graph that need highlighting. All the points of this set meeting the condition you enter here will be colored according to your specifications (all of this information is entered after pressing the Insert Button).
Set Window - Style Tab ( Intermediate and and Advanced Level Graphs)
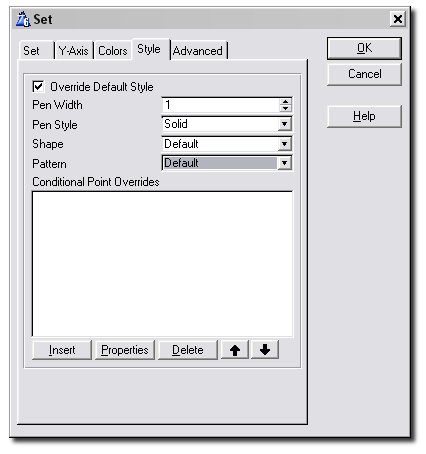
This Tab allows you to set the style used to draw your lines, scatter shapes, bars, etc. Note that this tab is only available when the
Template Level on the global
General Tab is set to Intermediate or Advanced.
- Override Default Style: This allows you to override the default style as assigned by the
Use Data Style option on the
Data Tab. These changes will apply to the whole set (if you only want to change the style settings of some points in the set then see
Conditional Point Overrides below).
- Pen Width: The width of the pen used to draw lines.
- Pen Style: The style of the pen used to draw lines.
- Shape: The shape of your scatter or line graph points. Note that, if
BlackAndWhite is turned on on the
Properties Tab, your scatter and line points will always be square.
- Conditional Point Overrides: This option allows you to override the style for a select group of points, based on some condition.
It allows you to highlight points on the graph that need highlighting. All the points of this set meeting the condition you enter here will be styled according to your specifications
(all of this information is entered after pressing the Insert Button).
Set Window - Advanced Tab (Advanced Level Graphs)
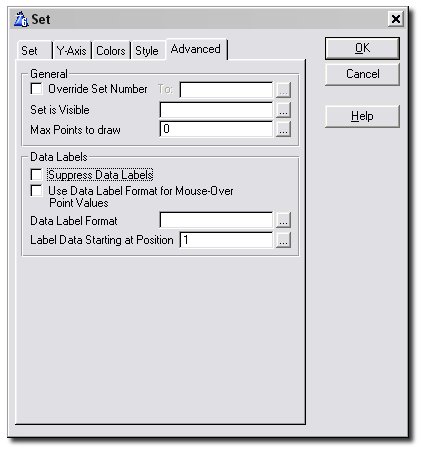
This tab contains a number of advanced options. Note that this tab is only available when the
Template Level on the global
General Tab is set to Advanced.
- Override Set Number: Allows you to override the set number for this group of points.
You could give it a fixed number you particularly want it to have, like 1, 2 or 3. The more common use for this, though, is illustrated in the
jumpstart. The idea is to remove the need for you to enter every set separately on the
Data Tab when a data point's set number is stored in a field of the record of the data queue or file it belongs to.
This is also useful if you want to collect data from different places, and yet graph them all as part of one set as if they were all stored in the same place.
- Set is Visible: Enter a variable name or expression (which should contain or evaluate to either 1 or 0)
which determines whether this data set should be visible on the graph or not.
- Max Points to Draw: This is the maximum number of points of this data set Insight will draw.
Leave it at 0 if you want Insight to draw all the points in this set.
- Suppress Data Labels: Tick this on if you do not want the labels for the data points in this set to be
drawn even though you switched the
Show Data Labels option on the
Data Tab on.
- Use Data Label Format for Mouse-Over Point Values: Check this if you want the set's Data Label Format (specified in the entry below) to be used for displaying the point values in the set's mouse-over information. For this set, the specified Data Label Format will be used instead of the
Point Value Format specified on the
Mouse Move Tab.
- Label Data Starting at Position:
Enter here the position of the point on the x-axis where you want to start
labelling the data of this set, e.g. first, second or third. The main use of this is to avoid cramming too many data labels into too small a space.
For example, say you had two sets, and you are
labelling your data points every 2 points (specified on the
Data Tab). You could enter the value 1 here for your first set, and the value 2 for your second.
Then there will only be one data label appearing at every given x-point, and the set the data label belongs to alternates.
- Use as Total for 100%: Tick this if you want the data to be displayed as percentage values on
the y-axis and you want this set's value at each x-axis point to be used as the total for calculating those percentages. If you
don't want this set to be visible (typically you wouldn't, as it will be 100% at each x-axis point), just make it invisible.