Introduction
The CapeSoft Profiler allows you to locate the slow
points in your application code. Profiler runs your application in its
environment, and builds a list of all the source lines, allowing you to
see which lines are taking the most time. Using the source list Profiler
will point you to where you need to re-factor your code to optimize your
application.
Features
- Simple to use with your program (just turn on full debugging and
compile.)
- Gathers useful statistics such as the number of times that a source
line is executed and the CPU time taken to execute.
- Reveals slow sections in your application that appear even in well
written code.
Support
| CapeSoft Support |
| Email |
 |
| Telephone |
+27 87 828 0123 |
Your questions, comments and suggestions are welcome. Check our web page (
capesoft.com) for new versions. You can
also contact us in one of the following ways.
Profiler is available for purchase from:
Overview
The Profiler is a tool to show you which parts of your
code are using the most CPU time. The Profiler can be used to highlight
the slow points in your code however it is up to you to assess if the time
taken is reasonable or not.
The method that the Profiler uses to compute the CPU time for each line of
your source code adds a huge overhead to the work that the CPU has to do.
This means that your program will run very slowly in the sections of code
being profiled. The good news is that you do not usually have to complete
the whole process to find the slow points. By running the process and
watching where the time is being spent you can often pinpoint the problem
areas without waiting hours for complete profiling of your application.
The CapeSoft Profiler will run your application as a child process. This
is done in the same way as running your application under the clarion
debugger. You will notice that if you quit the Profiler then your
application will be terminated.
The GoFaster demo application code is supplied with Profiler. See your \Clarion\Examples\Profiler folder. This is an
ordinary Clarion application. You may recompile GoFaster in LOCAL or
STANDALONE modes if you would like to. The Profiler will work with either.
Installation
- Run the supplied installation file.
Preparing your Application for
profiling
- While the App is Open, select Debug from the Set Configuration item
in the Build menu:
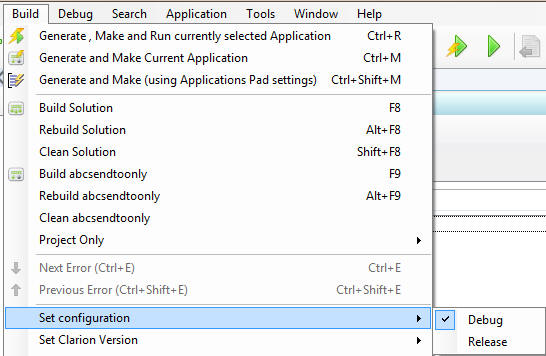
- Now compile your application
Using the Profiler
Profiling your Application is easy.
- Run the Profiler. It will open on the "Select File to Profile"
window.
- Type the full path and filename of the Application to be profiled
into the "File to Profile" entry box. You
may use the file selector button.
- Optionally enter any required command line switches into the "Command Line Parameters" entry box.
- Optionally enter a start in folder. The default is the Application
folder.
- In the "Source Search Directories" group, enter the Clarion folder
used to compile your Application in the "Clarion
Directory" entry box. The Profiler will search here for
source files that are not found in your Application folder.
- Optionally specify a folder to be searched if the source file has
not been located. This is useful for profiling DLL's used that are
compiled elsewhere.
- Click "Load" to run your Application under the Profiler. This opens
the "Add Source Lines to be profiled" window.
- Select the Modules / Procedures that are to be profiled. You can
either right-click and use the popup menu, are use the Add
Line/Procedure/Module button
- Click "Continue" to proceed with the profiling.
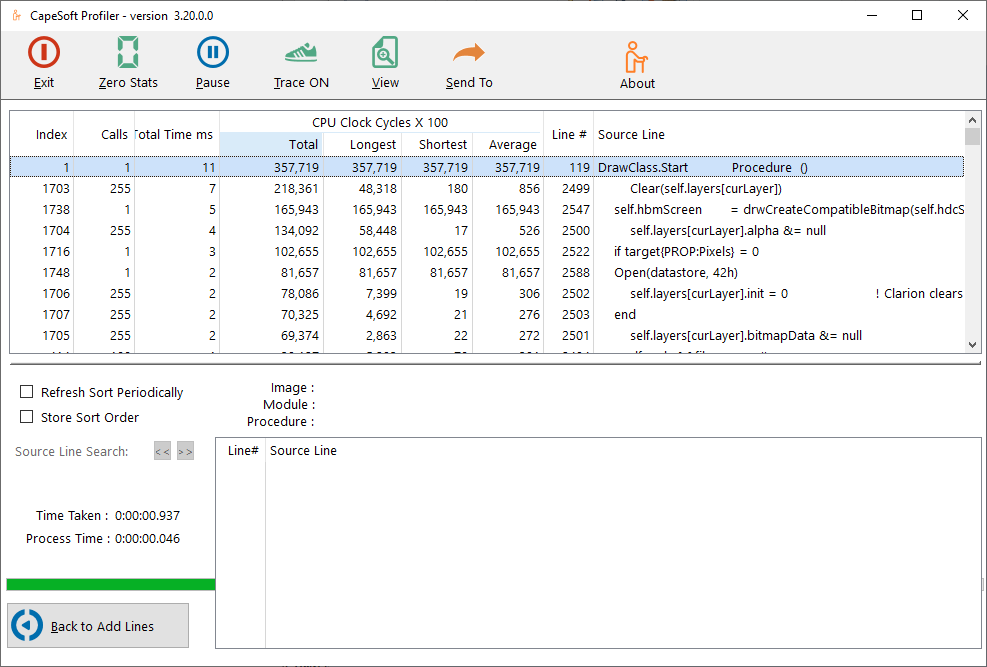
- Every time you click on a column header then the Profiler will
re-sort the data in that column order. Use this to locate the "slow"
lines of code by clicking on the "Total Time" column. You can check
the Refresh List Periodically check box to
periodically refresh the list according to the sort order that you
have chosen. To make your chosen sort order the default (it's a good
idea to use Approximate Total Time) next time you run, check the Store Sort Order checkbox.
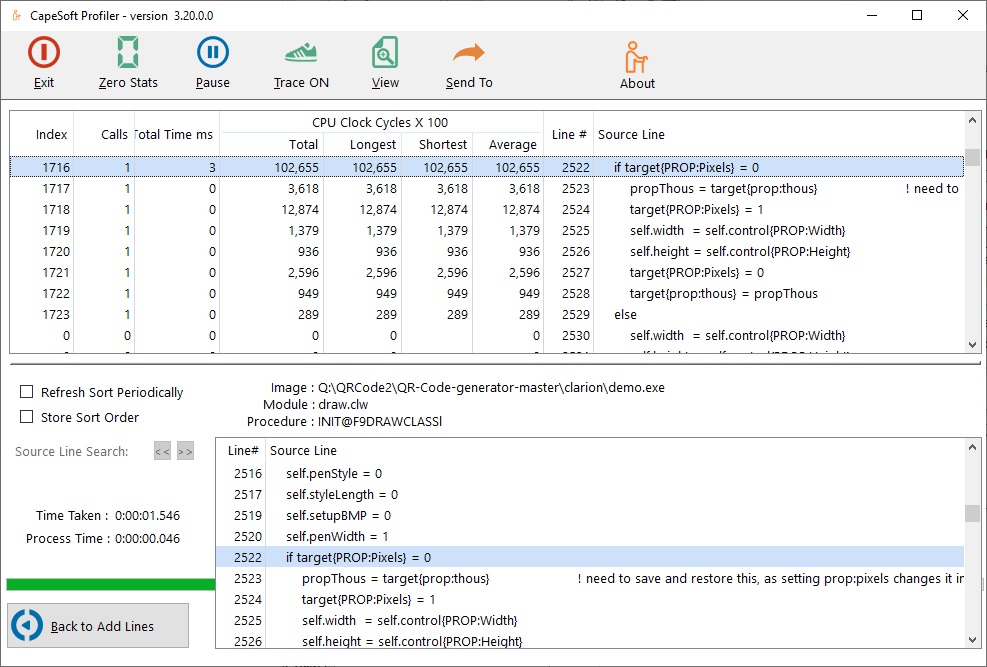
- If you click on a profiled line then the procedure containing that
line will be shown in the list box below the profiler data. Use this
to locate where in your code the source line is.
The
Refresh List Periodically check box is used
to force the list to sort the queue every 10 seconds by the currently
selected sort order
The
Time Taken is the sum total for all
instructions executed (converted to real time - as if the program was
running outside the Profiler environment). This excludes idle time.
The
Process Time is the time that the program
has been running for within the Profiler environment.
Examples
There is an example in your
\Clarion\Examples\Profiler directory.
This is used with the Profiler "Run Tutorial" option.
Tips & FAQ's
Clarion Versions : Profiler
works with Applications compiled in all Clarion versions.
- TIP 1: Place an EXIT statement at
the end of each routine. This does not change your code (the compiler
adds this if you omit the EXIT) however it makes interpreting the
profiler data much easier.
- TIP 2: Place a RETURN at the end of
each procedure. This does not change your code (the compiler adds this
if you omit the RETURN) however it makes interpreting the profiler
data much easier.
Install FAQ
- My SAF code that I
received with my Profiler purchase no longer works. This is
most likely because you are trying to download Profiler install, but
you have not purchased an upgrade to the latest. You can download the
old Profiler version 2 (without purchasing an upgrade) from:
www.capesoft.com/ftp/public/profiler2install.saf
Upgrade FAQ
- What's new
in Profiler 3
- Windows 64 bit support: Profile your application in a 64 bit
operating system. (Your application is still a 32 bit
application.)
- Clarion 8 support: Improved support for running in a Clarion 8
environment.
- Cleaner interface: Improvements to stored settings, easier to
manage selection (wizard shortened), resizing improvements, etc.
- For more info, check the Version
History
What must I do to my application after upgrading to
Profiler 3:
- Nothing. Continue using Profiler exactly as you were using
Profiler 2 previously.
How do I upgrade: You need to purchase an
upgrade from ClarionShop:
https://www.clarionshop.com/checkout.cfm?pid=1409&q=1&
Why is Capesoft charging for an upgrade: As
much as we can we try to keep upgrades free. Charging an upgrade gives
us the resources to pack in a whole lot of extra functionality into a
product, that we would otherwise not be able to do. We are not forcing
you to upgrade - and we will continue supporting Profiler 2 with it's
current limitations.
FAQ
- Why does the Profiler show some of my procedure
variables and class declarations as being executed when the
procedure is profiled?
This occurs where the variables are declared, locally or inside your
class, and are initialized to some value. What happens is that the
clarion compiler adds code to the beginning of your application which
initializes these variables to zero or spaces as required. Using the
AUTO attribute may be an option for your application however you might
then need to initialize these variable yourself.
- Why does lots of time get allocated to the last
line of my routine? I expect the RETURN to be quick.
The Profiler allocates all the CPU time from the start of a profiled
line to the start of the next profiled line. This can be confusing.
As an example if routine A calls routine B.
If you profile routine A but not routine B then all the CPU time for
routine B is allocated to the "DO routine B" line in routine A.
If you profile both routines then the "DO routine B" line is quick and
each line of routine B gets its own CPU time.
If you only profile routine B then all the CPU time outside of routine
B is allocated to the last line of routine B.
- When I try to profile my application, I get a 'Load failed'
message.
The most likely reason is that there is a resource that your
application uses that is not in the application directory. The easiest
way to find this is to clear your PATH environment variable (google on
how to do this), and then run your application, and it will complain
about the missing resource. Locate the dll/resource and copy it into
your application directory. Rinse and repeat until your application
runs with all the resources in the application directory. You should
then be able to profile successfully.
What the
Users are saying
Jim Kane (article on the
softvelocity.clarion.third_party news group), 13 April 2006:
....I ran the profiler first and it showed me that a call to a com method
was taking virtually 99% of the time for a procedure to run. Optimizing
queue vs array would have been pointless. Sometimes knowing what not to do
is as important as what to do.
Highly recommended. Beats the heck out of flying blind.
Gregory Bailey (article on the
softvelocity.clarion.third_party news group), 13 April 2006:
I found that using it made a huge difference in the wall clock timing of a
large piece of code that I inherited from another long gone
developer....Rewriting those bits of code allowed the process to complete
in 1 - 3 hours a night. The customer is ecstatic with the results. Sure
this could have been done without Profiler, but I still would be looking
for code to optimize and might not have connected the 5 places in
different portions of the code that read that same file.
Andre Doman (an email February 03, 2012):
I just started using profiler. What a stunning product. It took me
10 minutes and I know where my problem is.
Russ Eggen:
"consider Profiler a mandatory tool in your debugging tool kit."
Bill Wilson:
"But with Profiler and the techniques Bruce demonstrated, I had loaded
this project, found over 3.5 seconds of the (4 second) problem, fixed it
and recompiled within 10 minutes...So a big thanks to Bruce and the Team
at CapeSoft for an exceptional tool. 10/10!"
License & Copyright
This product is copyright © 2024 by CapeSoft Software.
You are
not allowed to copy any of the files,
including but not limited to, csProfiler.exe and documentation files.
None of the included files may be distributed.
Each developer needs his own license to use Profiler. (Need to
buy more licenses?)
This product is provided as-is. CapeSoft Software and CapeSoft Electronics
(collectively trading as CapeSoft), their employees and dealers explicitly
accept no liability for any loss or damages which may occur from using
this package. Use of this package constitutes agreement with this license.
This package is used entirely at your own risk.
Use of this product implies your acceptance of this, along with the
recognition of the copyright stated above. In no way will CapeSoft , their
employees or affiliates be liable in any way for any damages or business
losses you may incur as a direct or indirect result of using this product.
For the full EULA see
https://capesoft.com/eula.htmlVersion History
Download latest version
here
Version 3.20 (13 March 2020)
- Updated: Documentation
- Fix: SendTo Window was MDI, so would GPF the Profiler.
Version 3.11 (20
April 2016)
Version 3.10 (10 March 2015)
- Updated Interface
- Fixed problem with Command Line Parameters option not priming
correctly
Version 3.00 Beta: (7 November 2012)
- Full support for Clarion 7 and 8
- Full support for Windows 64bit OS
- Combined Select File to Profile and Source Search Directories into
one window
- Auto-detect clarion 7 or Above switch (from previous stored
setting).
- Clean up tool bar buttons (Zero Stats was displayed superfluously).
- Match Add Lines/Procedures/Modules/All Lines button to the
right-click option.
- Default to select line 1 in left list (for Add Source Lines to be
profiled window).
- Move SendTo button to the toolbar
- Fix resize of lists (to not overlap options, Source Search and Info
group on the bottom left).
- Add "Refresh List Periodically" option
- Add "Store Sort Order" option
- AnyFont added (ability to change global font if font size is too
large/small)
Version 2.01 Gold: (17 March 2010)
- First public gold release (no changes from the 2.00 release).
Version 1.20 Beta: (21 January 2010)
- Clarion 7.1 compatible install.
- SendTo added (allows saved output to Excel/Word/Printer/Email)
- Source search added (allows search through profiled lines in pause
mode)
- EXE bound to one processor.
- New "Back to Add lines" which allows you to add other modules and
procedures without having to quit and restart the profiler.
Version 1.01 Beta: (10 November 2008)
- Clarion 7 compatible install.
Version 1.00 Beta: (24 November 2005)